International Journal of Agriculture, Environment and Biotechnology
Citation: IJAEB: 13(1): 93-98, March 2020
DOI: 10.30954/0974-1712.1.2020.12
©2020 IJAEB All rights reserved
AGRICULTURAL ECONOMICS
Growth and Instability Analysis of Area, Production and Productivity of Paddy in Kerala, with Special Reference to “Te Kerala Conservation of Paddy Land and Wetland Act, 2008.”
Divya Lekshmi, U.* and Venkataramana, M.N.
Department of Agricultural Economics, University of Agricultural Sciences, GKVK, Bengaluru, India
*Corresponding author: divyalk89@gmail.com ( ORCID ID: 0000-0002-0530-835X)
Paper No.13
Received: 16-10-2019
Revised: 17-01-2020
Accepted: 28-02-2020
ABSTRACT
Rice is the staple food of Keralites. Kerala climate is well suited for wetland paddy cultivation. However, the paddy land in Kerala is decreasing over years. The Kerala conservation of paddy land and wetland Act, 2008 made a slight change in this decadal decreasing trend. In this study, Bai-Perron test identified a structural break in area, production and productivity during 2007-08 and 2009-10, which could be associated to the conservation act. The compound annual growth rate for area and production was found to be negative . The growth in area diminished before and after the break, but the diminishing rate was less after the break (-2.52%) than the period before the break date (-4.40%). So, as in the case of production. Productivity showed a positive growth rate for the overall period. Instability in production was high after the break date, whereas, instability in area remained almost same for both before and after the break dates. Exponential growth model was used for forecasting. The forecasted area and production up to 2030 showed a declining trend. The forecasted results on area showed that there will be a decline of around 36,444 ha in another 12 years. Similarly, the production will also come down to 3,70,795 t.
Highlights
 Structural break in paddy area, production and productivity was found to be coinciding with the commencement of the conservation act of 2008.
 The trend in paddy area in Kerala was found to be constantly declining, however, the rate of decline was less (-2.52%) after the implantation of the act.
Keywords : Bai-perron break, Growth rate, instability and Kerala paddy
Kerala, the state blessed with north-east and south-west monsoon is well suited for wetland paddy cultivation. Rice is the staple food of Keralites. The total area under paddy cultivation in 2017-18 is around 1,70,000ha (DES, Kerala) and production is 4,37,114 t. Still the state is depending largely on other states for rice. This is due to the steady decrease in paddy area, the state had been witnessing since decades. Paddy area started diminishing from 1970s (Suchithra 2015). Paddy area diminished from 8,50,000 ha in 1980-81 (Thomas 2011) to 1,70,000 ha (2017-18) which showed that around 80 percent decline in last 28 years. Rice that occupied the major share among the cultivated principal crops, now in the third position with 9.7 per cent (DES, Kerala) of gross cultivated area. Coconut and rubber, the high value cash crops replaced rice and occupied the major share of gross cropped area. According to Suchithra, 2015, the major obstacles for rice production in Kerala are the small land holdings, high cost of production, moderate yield and low market prices. These circumstances led to the conversion of paddy land for non-agricultural purposes. Out of the many reasons identified, land conversion for non-agricultural purposes like industry, infrastructure, housingetc. grabbed the lion share of Kerala’s paddyland and wetland. The lessening rice area and production significantly affected the socio-economic and ecological development of the state.
The Kerala conservation of paddy land and wetland act came in to force from the year 2008 to protect these areas from reclamation or conversion and thereby ensuring the ecosystem balance and food security of the state. This act aimed at conserving the wetland and paddyland ecosystem and at the same time it has provisions to promote the paddy cultivation in the state. The act only permits intermediary crops that does not destroy the natural ecosystem of paddy. Promoting fallow land cultivation is the major attraction of this act. Even though the act is existing the paddy area in Kerala is declining from year to year.
The Kerala Conservation of Paddy land and wetland Act, 2008
The Kerala conservation of paddyland and wetland act, 2008, an act to conserve the paddy land and wetland and to restrict the conversion or reclamation thereof, in order to promote growth in the agricultural sector and to sustain the ecological system, in the state of Kerala. Indiscriminate and unrestricted conversion of paddy land and wetland made the government of Kerala to put forth the conservation act. Since there was no existing law to resist the conversion effectively, government enacted this act in 2008. This act came in to existence on public interest to promote the agricultural growth and to sustain the ecosystem balance in the state.
The act extends to the whole of the state of Kerala and it prohibits the conversion or reclamation of paddy land on and from the date of commencement of this act. The owner is allowed to cultivate any intermediary crop that do not change the ecological nature of that paddy land and strengthening of the outer bunds for protecting the cultivation. As per the act, the government shall take suitable measures from time to time, in order to assist the farmers to augment the production of paddy in the state. There shall be a local level monitoring committee in each panchayat or municipality, presided by the panchayat president or municipal counsellor along with agricultural officer, village officer and three farmer representatives to monitor the implementation of the provisions of this act.
The committee have the powers to recommend to the state level committee with the agricultural production commissioner, the commissioner of land revenue and an expert from the field of environment and a scientist in the field of paddy cultivation as members or district level authorized committee with revenue divisional officer, principal agricultural officer and three paddy cultivators nominated by the district collector as members, regarding the reclamation of paddy land for public purpose or for the construction of residential building for the owner of the paddy land. Besides this, the committee should inspect the paddy land situated within the jurisdiction to monitor whether the provisions of this act are being complied with and to report to the Revenue Divisional Officer (RDO) regarding violations, if any. The committee also examine the complaints received from the public regarding the attempts to violate the act and also the reason for keeping the paddy land fallow. The committee is responsible for giving remedial measures so as to persuade the holder of paddy land to cultivate it with paddy or any intermediary crops.
Keeping this act in to consideration, this study analyses the presence of structural break, trend and instability in the area, production and productivity of paddy in Kerala from 1998-99 to 2017-18.
MATERIALS AND METHODS
This study completely relied on secondary data collected from the official website of the Directorate of Economics and Statistics. Time series data on area, production and productivity of paddy from 1998-99 to 2017-18 was used for the analysis. The study aimed at finding out the structural change in area, production and productivity and to analyze the trend followed, which could further be used for forecasting of area and production of paddy for a future date.
Structural break analysis: Bai-Perron test
Structural break refers to the unexpected shift in the time series data, that can lead to severe forecasting errors and can affect the reliability of the results. Consistency in the parameters like mean, median and trend in the data i.e., the stationarity of time series data is assumed for a good forecasting model. According to Bai and Perron structural break can occur due to several reasons including policy changes, economic crisis, institutional changes and regime shifts. In most of the cases the researchers may consider only one break for the entire time based on some apriori information. But this may not be the case in all times, there could be more than one break or multiple breaks in a time series data due to several reasons. In this study, Bai and Perron test was employed to check if there is any structural break in the data. This test helps in detecting breaks in the data with no prior information. We consider the following linear regression with m breaks (m+1 regime):
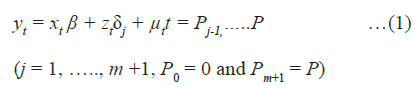
Where, ytis the dependent variable, covariates are denoted as xt ϵ R pand ztϵ Rq β and δ jare the corresponding vectors of coeffcients with δ i ≠ δ(1 ≤ i ≤ m)and µ t is the error term at time t.The break dates (P,….,Pm) areexplicitly regarded as unknown. It may be noted that this is a partial structural change model in so far as β doesn’t shift and is effectively estimated over the entire sample.
Least squares principle is the basis of Bai-Perrron (1998) estimation. For an m-partition (P1,….,Pm ),represented {Pj } ,the related δ i , ,least square estimators found by minimizing the sum of squared residuals.
Minimizing the sum of squared residuals
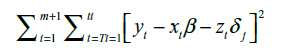
The resulting estimate for the constraint δ i ≠ δi+1 (1 ≤ i ≤ m)is δ ({Pi}).Substituting this in the objective
function and representing the resulting sum of squared residuals as ST (P1,….,Pm ), the estimated break dates (P1, Pm ) aresuch that,

where, Algminis denotes algorithm minimum and the minimisation are taken for all partitions from Pito Pmsuch as Pi - Pi-1 ≥[εP] .The minimal number i m ii-1 of observations in each segment is given as [εP]. So, the estimated break points are global estimators of the objective function. At the end, the parameter estimates are found out using least square estimates at the estimated m-partition, {Pj}} i.e.δ = δ({Pj}}) (Veerabadrappa 2016).

There are several statistical software packages to do the test. This study explored EViews for the analysis.
Compound annual growth rate
Compound annual growth rate was computed to assess the trend in area, production and productivity of paddy in Kerala. Several models were tested to find the good ft model and finally end up with the exponential model for analysing the growth rate. The functional form is as follows:
Where,
Yt : Dependent variable (area/production/ productivity)
α: Intercept
b: Regression coefficient
t: time in years (1, 2, …, n)
ut : Error
The equation was estimated using Ordinary Least Square (OLS) technique by converting it in to log linear form. The compound annual growth rate (CGAR) in percentage was then computed from the following relationship, CGAR= (Antilog of b–1) × 100.
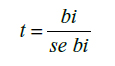
Student ‘t’ test was used to test the statistical signifcance of the coefficients. ‘t’ statistic can be calculated using the formula,
where,
bi = Regression coefficient
se(bi)) = Standard error of bi
Model adequacy
There are several measures to check the adequacy of the model used. Coefficient of determination is one such measure, which is defined as the amount of variation in the dependent variable that is explained by the independent variable. In simple terms it explains the goodness of ft of the model. A model with high R2 indicates that the model chosen is a good one.
Instability index
The variability in the area, production and productivity of paddy was found out using the coefficient of variation.
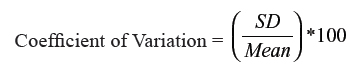
Where, SD is the standard deviation
Cuddy and Della (1978) suggested the formula to fnd instability index using coefficient of variation,
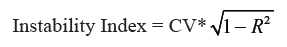
Where, R2 is the coefficient of determination. Higher the instability index, higher the variability.
RESULTS AND DISCUSSION
Structural break analysis
Structural break in area and production of paddy coincided with biennium ending 2007- 08 (Table 1). This clearly indicated the impact of the Kerala conservation of paddy land and wetland act of 2008, due to which the conversion of paddy land was restricted. There was a slight increase of 5,062 ha in paddy area and a remarkable increase of around 65,812 t in production of paddy during the period of 2007 to 2009 (Table 1), results matching with the findings of J.J. Thomas, 2011. Though the increase in paddy area was marginal, it reversed the decreasing trend in paddy area. Hence, it was remarkable. As an immediate effect of the act and at the same time the confusions and anxiety on the enforcement of the act made a slight positive change in the area during this period. The increase in area definitely had an effect on the increase in the overall production.
Table 1: Structural break dates in area, production and productivity of paddy
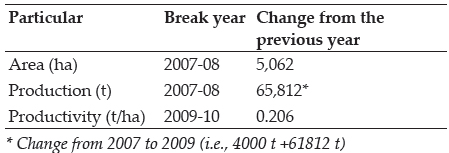
Unlike the area and production, the break in productivity was observed during 2009-10, could again be considered as the impact of the Kerala conservation of paddy land and wetland act, 2008. The productivity showed an increase of 0.206 t/ ha during the break period. As a part of the act, the government introduced several new schemes to promote paddy cultivation, which included the seasonal training programmes on integrated farming systems with special reference to the rice-based cropping systems which consists of fish, poultry, goat, cow etc. and awareness programmes on the importance of wetland and paddy land conservation. These government initiatives made a noticeable increase in the productivity of paddy.
Growth and Instability analysis
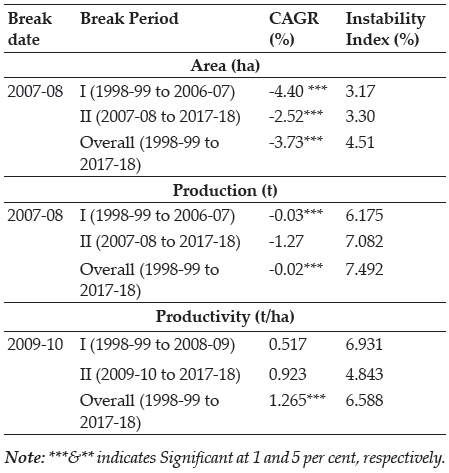
Compound annual growth rate was found for three periods considering the structural breaks. For area and production, based on the break year the overall period was divided in to two. Period I starting from 1998-99 to 2006-07 and period II from 2007-08 to 2017-18 (Table 2). Whereas for productivity period Iwas1998-99 to 2008-09 and the period II started from 2009-10. Compound annual growth rate for area for the overall time period turned out to be negative with 3.37 percent. The rate diminished during both the periods but the rate of decline was found to be less during period II (-2.52%) than period I (-4.40%). This was due to the enforcement of the Kerala conservation of paddy land and wetland act, that promoted fallow land cultivation. A similar trend was observed in the case of paddy production. The rate of decrease was more during period I than period II. Except for paddy productivity, paddy area and production were showing a negative trend, this was similar with the results of Nethravathi. A.P and Yeledhalli. R.A ‘s study on rice in Bengaluru urban.
Instability index for the break periods (Table 2) showed that there was no remarkable variability in the paddy area before and after the break. This showed that almost same variation followed in paddy area, before and after the break. This could be due to illegal conversions after the act. The instability index for the overall period for paddy area was higher (4.51) than that of period I and II. This was due to the presence of huge variation in the overall area. Paddy exhibited a higher degree of instability during the overall period for production (7.49%) than that of period I (6.18%) and period II (7.08%). Hence, the variability in paddy production was found to be more in the overall period due to the structural break of 2007-08. The overall period and period I showed a higher instability in paddy productivity with 6.58 per cent and 6.93 per cent respectively. While the instability was 4.84 per cent during period II, indicated a reduced variability in productivity after the structural break. The high instability was observed in paddy production (7.49%) followed by paddy productivity (6.58%) and paddy area (4.51%), this was similar to the findings of M. Satishkumar et al.,study on Indian rice area, production and productivity. The government interventions after the act, in the form of training programmes and input subsidies for seeds and fertilizers under the Sustainable Development of Rice (SDR) scheme, which provides an extra 1000 ₹/ ha along with the central seed and fertilizer subsidy of 4500 ₹/ha might have increased the efficiency of the paddy farmers and thereby resulted in a much stable productivity.
Table 2: Growth and instability in area, production and productivity of paddy in Kerala
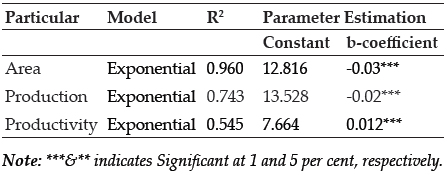
Estimated growth models for area, production and productivity in Kerala
In-order to analyze the trend in the data, different growth models were tested to find out the good ft for area, production and productivity from 1998-99 to 2017-18. For a better future prediction, it was necessary to find out a good ft model. Hence, both linear and non-linear growth models were examined to find out the best ft. The results were given in table 3. Exponential growth model was found out to be the best ft model for area, production and productivity with a pleasing coefficient of determination of 0.960, 0.743 and 0.545 respectively. The regression coefficients as well as the intercept values were found significant at 1 percent level.
Table 3: Good ft growth models of area, production and productivity of Paddy
Trend analysis
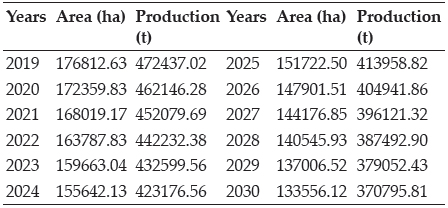
Exponential growth model was used for forecasting the area, production and productivity of paddy in Kerala up to 2030. The forecasted results showed a decreasing trend (Table 4). Area was found to decrease to around 1,33,556 ha by 2030 which is 36,444 ha less than that of the current area (1,70,000 ha), i.e., around 21 per cent reduction in another 12 years. This finding contradicted with Mahesh and Deepa’s (2016) forecasted area of 50,961 ha by 2030-31, where they used linear growth model for the trend analysis. There observed a decreasing trend in the forecasted paddy production. The estimated fall in paddy production found to be around 1,00,000t by 2030. The forecasted paddy production for 2030 was 3,70,795 t matched with the results of Mahesh and Deepa, 2016.
Table 4: Forecasted area and productivity of paddy in Kerala up to 2030
CONCLUSION
This study analyzed the structural break in area, production and productivity of paddy in Kerala from 1998-99 to 2017-18. The break divided the entire time period in to two, Period I and Period II. Trend and instability index were found out for the three periods including the overall time period. Bai-Perron test identified a structural break in area and production during the time of 2007-08 and for productivity the break date was obtained as 2009-10. The break was due to the Kerala conservation of paddy land and wetland act, 2008 which banned the reclamation or conversion of paddy and wetland and promoted paddy cultivation. The compound annual growth rate for area and production as found to be negative. Though the growth rate was declining for both before and after the break date, the declining rate was less during the second period in the case of area. Unlike area and production, the productivity showed an increasing trend for the overall period.
The calculated instability index turned out to be higher for production during the overall period (7.48%). While for productivity, the instability was less in the second period than that of the first period. Paddy promotion programmes of the government including training programmes on paddy cultivation with efficiency might have influenced the productivity positively and was reflected in the low instability index of during period II than that in period I. Integrated rice-based farming systems would increase the productivity as well as the overall efficiency of the farm and farmers.
In-order to find the trend in paddy area and production different growth models were examined for getting the good ft. Both linear and non-linear models were assessed for their model adequacy. Exponential model found to be good ft for area, production and productivity of paddy with high coefficient of determination (R2) value of 0.960, 0.743 and 0.545 respectively. The forecasted results on area showed that there would be a decline of around 36,444 ha in another 12 years. Similarly, the production also showed a declining trend with a forecasted production of 3,70,795 t by 2030.
Even after the implementation of the conservation act, the paddy area in Kerala showed a declining trend and the forecasted area and production were also diminishing. This showed the necessity of effective implementation of the act. Keeping this in mind the government of Kerala should take necessary actions for the effective enforcement of the act, in such a way that the current cultivated paddy area in Kerala should not come down.The government of Kerala has to accept the challenge of retaining the staple food of Kerala.
REFERENCES
Anonymous. 2017. Department of Economics and Statistics, Department of Agriculture and Farmer Welfare, Govt. of India, New Delhi.
GAthira, H. and Kishore, K. 2016. Scenario Analysis of Rice Cultivation in Kerala. Journal of Extension Education, 5760: 5763.
Bai, J. and Perron, P. 2002. Computation and Analysis of Multiple Structural Breaks. Journal of Applied Economics, doi: https://doi.org/10.1002/jae.659
Maneesh, P. and Deepa, N.R. 2016. Trend Analysis of Area, Production and Productivity of Rice in Kerala in the Context of Food Security. International Journal on Agricultural Research Review,4(8): 538-546.
Nethravathi, A.P. and Yeledhalli, R.A. 2016. Growth and Instability in Area, Production and Productivity of Different Crops in Bengaluru Urban. International Journal of Agriculture, Environment and Biotechnology,9(4): 599-611.
Satishkumar, M., Harishkumar, H.V., Ramesh, Rangegowda, R. 2016. Growth, Export Performance and Competitiveness of Basmati and Non-Basmati Rice of India -an Markov Chain Approach. International Journal of Agriculture, Environment and Biotechnology,9(2): 305-311.
Suchithra, M. 2015. Rice at Risk. Down to Earth. https://www.downtoearth.org.in/coverage/rice-at-risk-43367 Thomas, J.J. 2011. Paddy Cultivation in Kerala. Review of Agrarian Studies,1(2): 215-226.
Veerabadrappa, B. 2016. Assessment of Production, Market Competitiveness and Ex ante Consumer Preference of Ragi in Karnataka: An Economic Analysis. Ph.D. Thesis (Unpub), Univ. Agric. Sci., Bengaluru.